

Industrial fluid and energy systems manufacturer Graham Corporation (NYSE: GHM) missed Wall Street’s revenue expectations in Q2 CY2025, but sales rose 11.1% year on year to $55.49 million. The company’s full-year revenue guidance of $230 million at the midpoint came in 1.3% below analysts’ estimates. Its GAAP profit of $0.42 per share was 78.7% above analysts’ consensus estimates.
Is now the time to buy Graham Corporation? Find out by accessing our full research report, it’s free.
Graham Corporation (GHM) Q2 CY2025 Highlights:
- Revenue: $55.49 million vs analyst estimates of $56.59 million (11.1% year-on-year growth, 1.9% miss)
- EPS (GAAP): $0.42 vs analyst estimates of $0.24 (78.7% beat)
- Adjusted EBITDA: $6.84 million vs analyst estimates of $5.29 million (12.3% margin, 29.3% beat)
- The company reconfirmed its revenue guidance for the full year of $230 million at the midpoint
- EBITDA guidance for the full year is $25 million at the midpoint, above analyst estimates of $24.52 million
- Operating Margin: 8.9%, up from 6.2% in the same quarter last year
- Free Cash Flow was -$9.26 million, down from $5.74 million in the same quarter last year
- Backlog: $482.9 million at quarter end, up 21.7% year on year
- Market Capitalization: $630.3 million
Graham’s President and Chief Executive Officer, Matthew J. Malone stated, “The start of fiscal 2026 demonstrates continued strength across our diversified product portfolio. We delivered strong growth in our Energy & Process markets, driven by execution on major commercial projects and robust aftermarket demand, along with increasing momentum in emerging energy segments such as small modular reactors ("SMRs") and cryogenics.
Company Overview
Founded when its founder patented a unique design for a vacuum system used in the sugar refining process, Graham (NYSE:GHM) provides vacuum and heat transfer equipment for the energy, petrochemical, refining, and chemical sectors.
Revenue Growth
A company’s long-term performance is an indicator of its overall quality. Any business can put up a good quarter or two, but the best consistently grow over the long haul. Thankfully, Graham Corporation’s 20% annualized revenue growth over the last five years was incredible. Its growth surpassed the average industrials company and shows its offerings resonate with customers, a great starting point for our analysis.
We at StockStory place the most emphasis on long-term growth, but within industrials, a half-decade historical view may miss cycles, industry trends, or a company capitalizing on catalysts such as a new contract win or a successful product line. Graham Corporation’s annualized revenue growth of 13% over the last two years is below its five-year trend, but we still think the results suggest healthy demand. 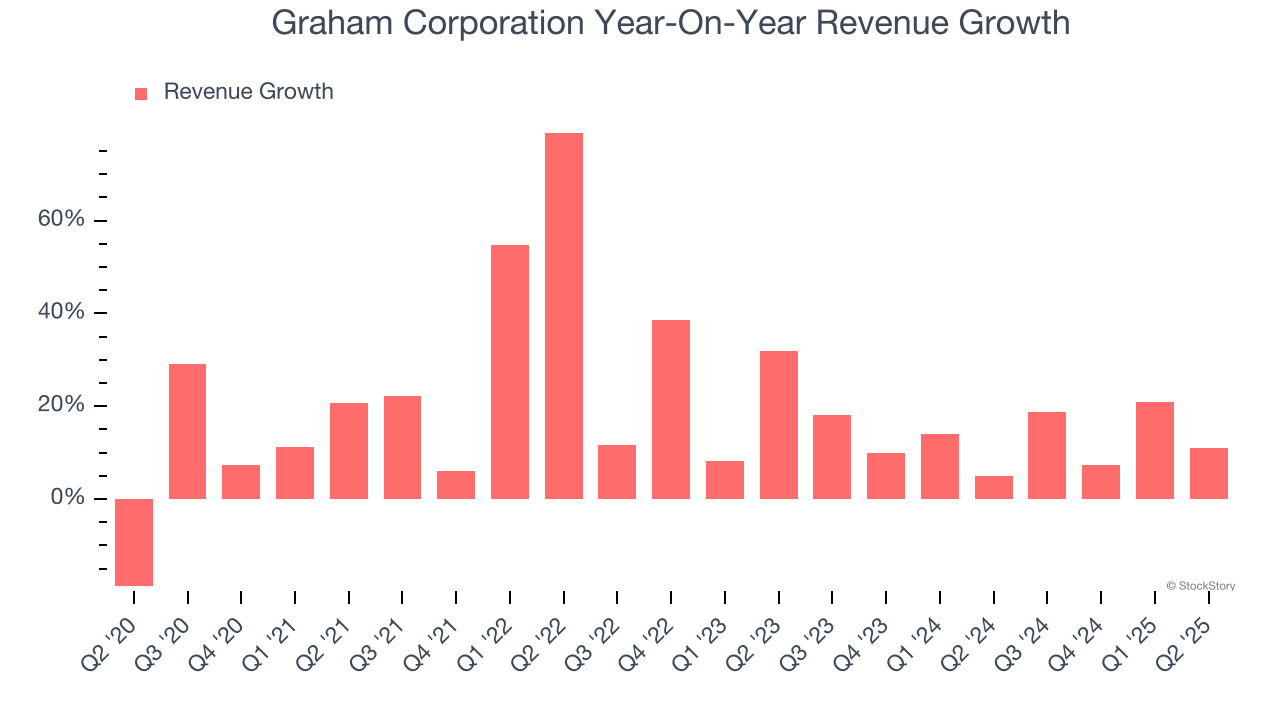
We can better understand the company’s revenue dynamics by analyzing its backlog, or the value of its outstanding orders that have not yet been executed or delivered. Graham Corporation’s backlog reached $482.9 million in the latest quarter and averaged 21.7% year-on-year growth over the last two years. Because this number is better than its revenue growth, we can see the company accumulated more orders than it could fulfill and deferred revenue to the future. This could imply elevated demand for Graham Corporation’s products and services but raises concerns about capacity constraints. 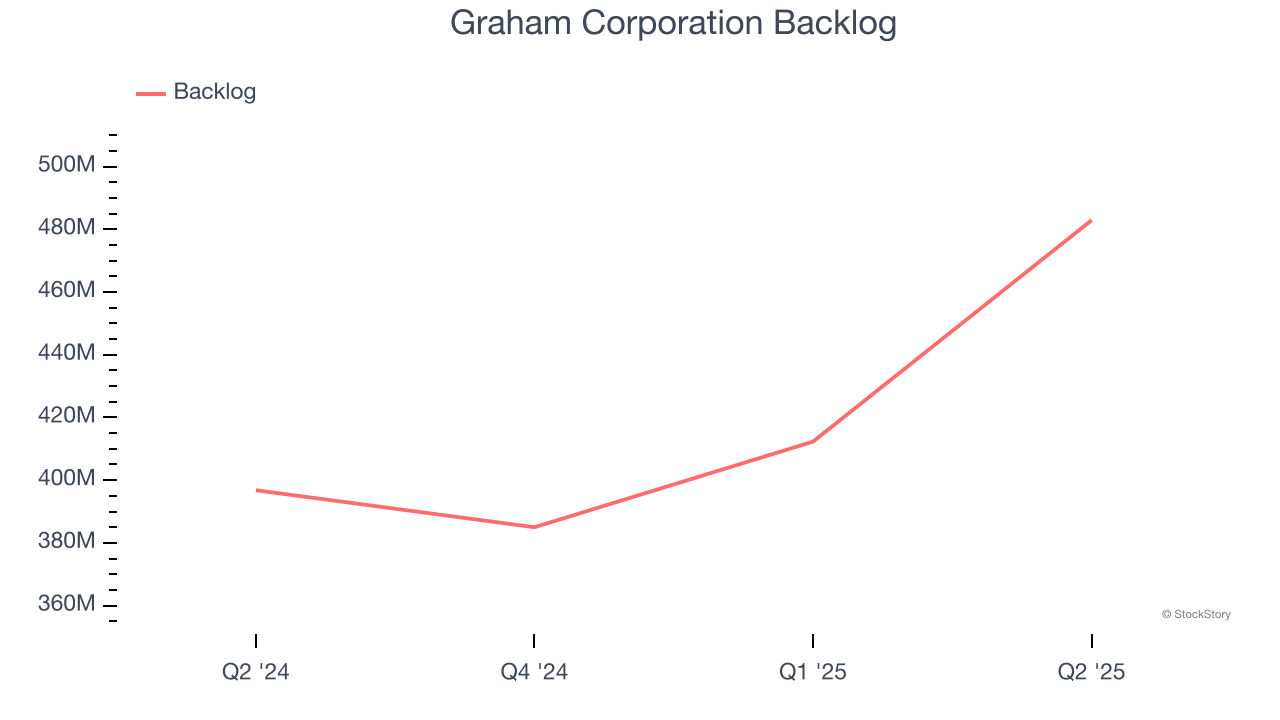
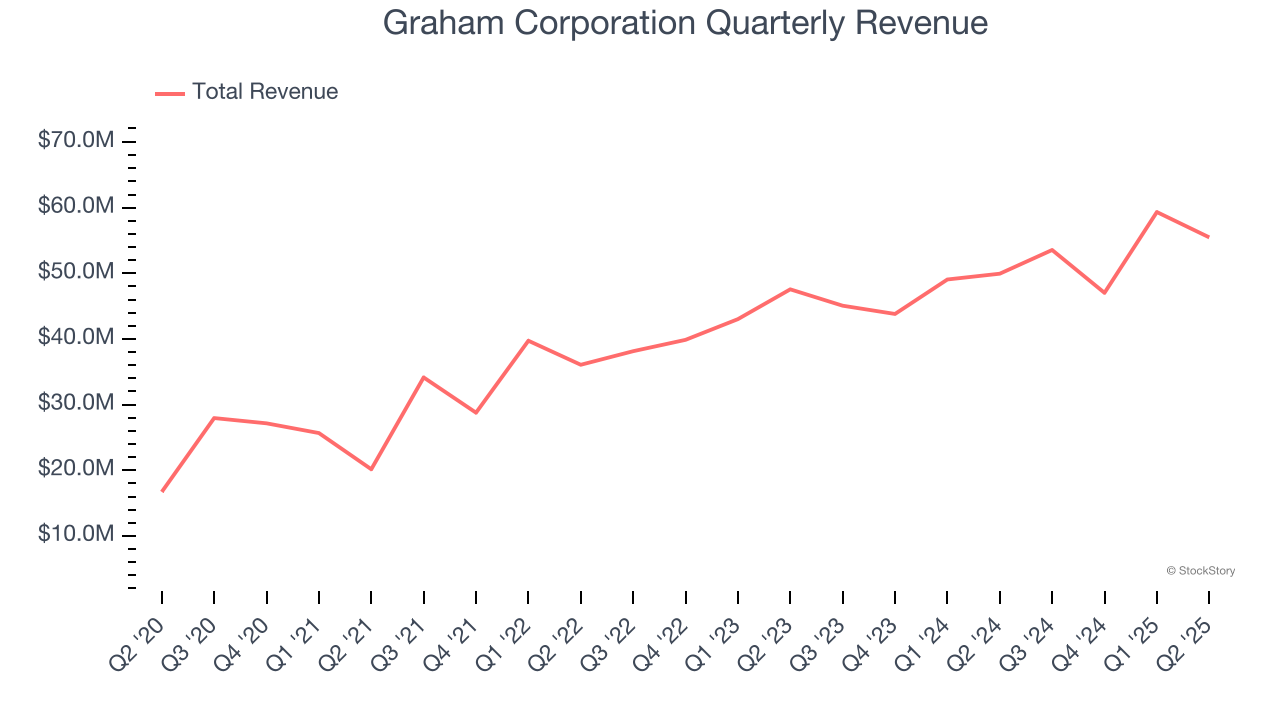
This quarter, Graham Corporation’s revenue grew by 11.1% year on year to $55.49 million but fell short of Wall Street’s estimates.
Looking ahead, sell-side analysts expect revenue to grow 10.4% over the next 12 months, a slight deceleration versus the last two years. Despite the slowdown, this projection is healthy and indicates the market is baking in success for its products and services.
Here at StockStory, we certainly understand the potential of thematic investing. Diverse winners from Microsoft (MSFT) to Alphabet (GOOG), Coca-Cola (KO) to Monster Beverage (MNST) could all have been identified as promising growth stories with a megatrend driving the growth. So, in that spirit, we’ve identified a relatively under-the-radar profitable growth stock benefiting from the rise of AI, available to you FREE via this link.
Operating Margin
Operating margin is a key measure of profitability. Think of it as net income - the bottom line - excluding the impact of taxes and interest on debt, which are less connected to business fundamentals.
Graham Corporation was profitable over the last five years but held back by its large cost base. Its average operating margin of 2.4% was weak for an industrials business. This result isn’t too surprising given its low gross margin as a starting point.
On the plus side, Graham Corporation’s operating margin rose by 4.4 percentage points over the last five years, as its sales growth gave it operating leverage.
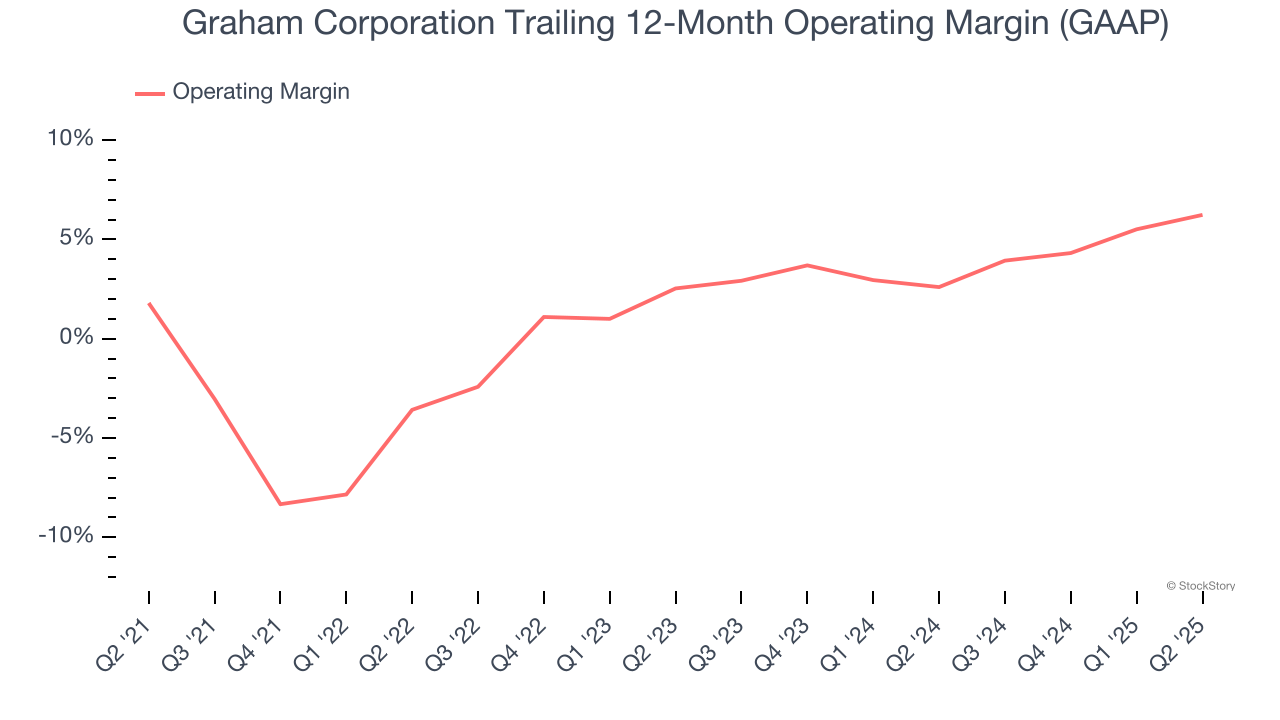
This quarter, Graham Corporation generated an operating margin profit margin of 8.9%, up 2.8 percentage points year on year. The increase was encouraging, and because its operating margin rose more than its gross margin, we can infer it was more efficient with expenses such as marketing, R&D, and administrative overhead.
Earnings Per Share
We track the long-term change in earnings per share (EPS) for the same reason as long-term revenue growth. Compared to revenue, however, EPS highlights whether a company’s growth is profitable.
Graham Corporation’s full-year EPS grew at an astounding 84% compounded annual growth rate over the last four years, better than the broader industrials sector.
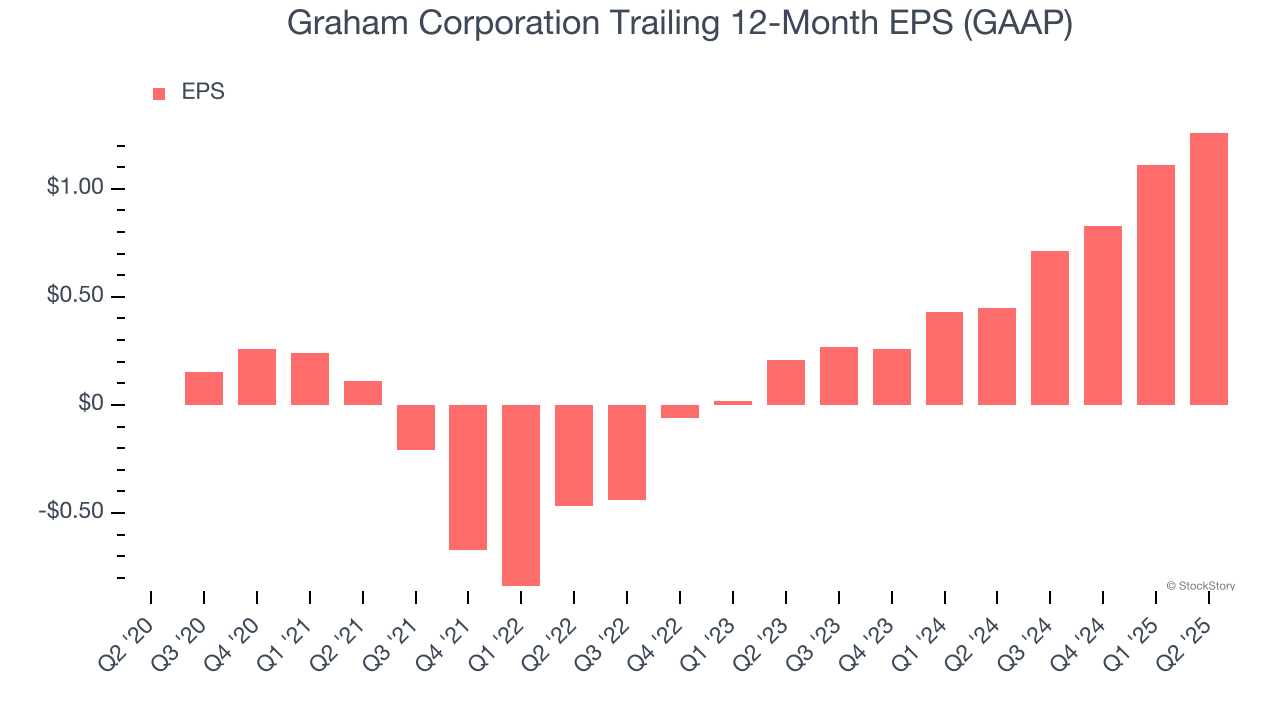
Like with revenue, we analyze EPS over a shorter period to see if we are missing a change in the business.
Graham Corporation’s EPS grew at an astounding 145% compounded annual growth rate over the last two years, higher than its 13% annualized revenue growth. This tells us the company became more profitable on a per-share basis as it expanded.
We can take a deeper look into Graham Corporation’s earnings quality to better understand the drivers of its performance. Graham Corporation’s operating margin has expanded by 1.2 percentage points over the last two years. This was the most relevant factor (aside from the revenue impact) behind its higher earnings; interest expenses and taxes can also affect EPS but don’t tell us as much about a company’s fundamentals.
In Q2, Graham Corporation reported EPS at $0.42, up from $0.27 in the same quarter last year. This print easily cleared analysts’ estimates, and shareholders should be content with the results. We also like to analyze expected EPS growth based on Wall Street analysts’ consensus projections, but there is insufficient data.
Key Takeaways from Graham Corporation’s Q2 Results
We were impressed by how significantly Graham Corporation blew past analysts’ EPS expectations this quarter. We were also excited its EBITDA outperformed Wall Street’s estimates by a wide margin. On the other hand, its revenue missed and its full-year revenue guidance fell slightly short of Wall Street’s estimates. Overall, this print was mixed. The market seemed to be hoping for more, and the stock traded down 1.8% to $56.43 immediately following the results.
Is Graham Corporation an attractive investment opportunity right now? We think that the latest quarter is only one piece of the longer-term business quality puzzle. Quality, when combined with valuation, can help determine if the stock is a buy. We cover that in our actionable full research report which you can read here, it’s free.